Improves daily weight gains, enhances meat quality, strengthens native immunity ! Growfeed
| Division | Control group | Experimental group | |
|---|---|---|---|
| Weight per head (kg) | Starting age (days) 30 60 90 |
58.2 90.2 120.5 130.7 |
57.6 95.0 124.7 136.7 |
| Total weight gain per head (kg) | Average | 26.9 | 29.5 |
| Daily weight gain per head (kg) | Average | 0.93 | 1.03 |
| Division | Control group | Experimental group | |
|---|---|---|---|
| Monthly intake per head (kg) | Starting age 1~30 31~60 Average |
58.2 90.2 120.5 130.7 |
57.6 95.0 124.7 136.7 |
| Daily intake per head (kg) | Starting age 1~30 31~60 Average |
- 86.4 95.4 126.9 102.9 |
- 86.4 90.9 126.9 101.4 |
| Feed conversion rate | Starting age 1~30 31~60 Average |
- 2.88 3.18 4.23 3.43 |
- 2.88 3.03 4.23 3.38 |
| Division | T-Cho | TG | GOT | GPT | 6LU | laG |
|---|---|---|---|---|---|---|
| Control group | 112.3 | 58.25 | 77.0 | 42.55 | 96.2 | 935.5 |
| Carcass performance | 109.4 | 59.30 | 69.60 | 41.05 | 102.3 | 977 |
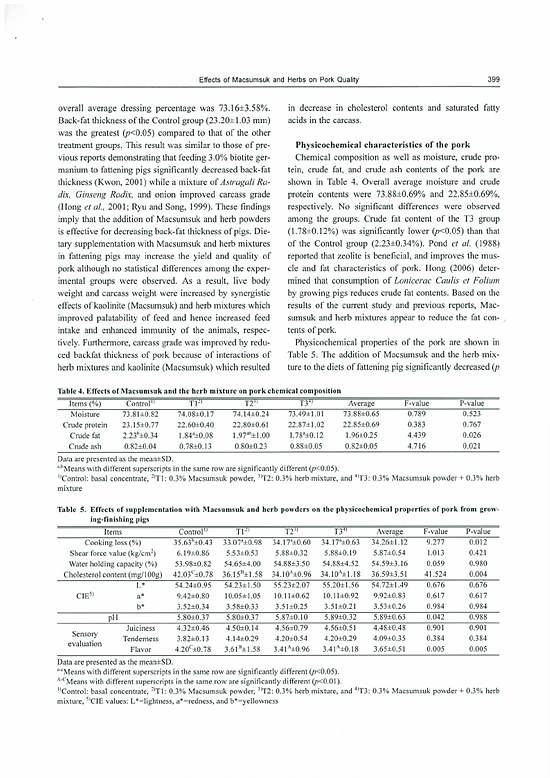
| Division | Control group | Experimental group |
|---|---|---|
| Carcass weight (kg) | 98.80 | 103.4 |
| Back-fat thickness (mm) | 23.2 | 19.6 |
| Division | Control group | Experimental group |
|---|---|---|
| Heating loss (%) Shearing force (Kg / 0.5 inch) Water-holding capacity (%) |
35.63 6.19 53.98 |
33.07 5.53 54.65 |
| Juiciness Tenderness Flavor |
4.42 3.82 4.40 |
4.5 3.84 4.54 |
| Cholesterol content (mg / 100g) | 42.03 | 38.15 |
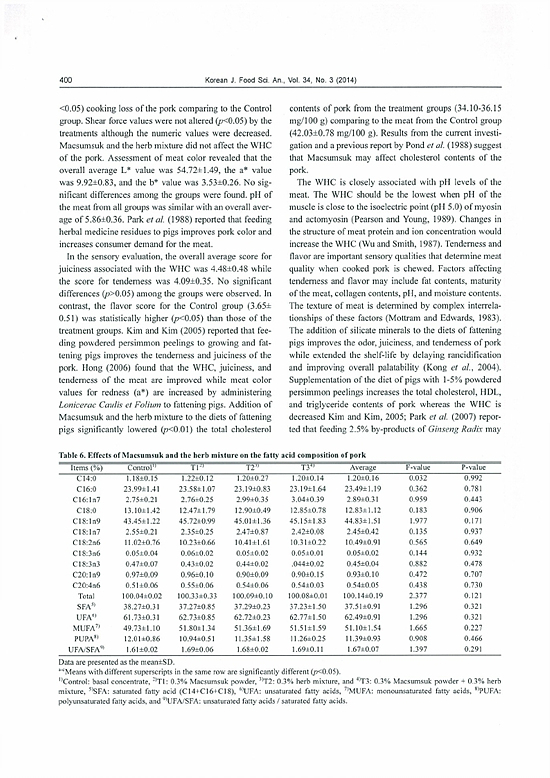
| Division | Control group | Experimental group |
|---|---|---|
| Saturated fatty acid | 38.58 | 37.77 |
| Unsaturated fatty acid | 61.42 | 62.53 |
| Monounsaturated fatty acid | 50.37 | 50.96 |
| Polyunsaturated fatty acid | 11.05 | 11.57 |
An experiment on ammonia-absorbing effect in pig shed with Growfeed Clean
| Division | Area (㎡) | Dosage | Heads | Before spraying | 30 min. later | 60 min. later | 90 min. later | Reduction rate (%) |
|---|---|---|---|---|---|---|---|---|
| Piggery | 130 | 24 | 150 | 38ppm | 18ppm | 15ppm | 11.4ppm | 70 |
| Starting date of the trial | Apr. 30, 2012 |
|---|---|
| Number of pigs | 1,200 heads |
| Trial period | Apr. 30, 2012 ~ Sep. 30, 2012 |
| Dosage of Growfeed E-Tox | Added 0.3% to feedstuff |
Without Growfeed E-Tox
| Shipping date | Heads shipped | Total weight shipped (kg) | Average weight per head (kg) | Consumed feed quantity (kg) | Feed requirement ratio |
|---|---|---|---|---|---|
| 2011.10 | 204 | 22,700 | 111.2 | 349.16 | 3.14 |
| 2011.11 | 166 | 18,020 | 108.5 | 320.07 | 2.95 |
| 2011.12 | 123 | 13,300 | 108 | 313.20 | 2.90 |
| 2012.01 | 124 | 12,330 | 99.4 | 291.24 | 2.93 |
| 2012.02 | 208 | 23,530 | 113 | 319.79 | 2.83 |
| 2012.03 | 248 | 27,065 | 109 | 313.92 | 2.88 |
| 2012.04 | 167 | 19,100 | 114.3 | 323.46 | 2.83 |
Added 0.3% of Growfeed E-Tox to feedstuff
| Shipping date | Heads shipped | Total weight shipped (kg) | Average weight per head (kg) | Consumed feed quantity (kg) | Feed requirement ratio |
|---|---|---|---|---|---|
| 2012.05 | 210 | 22,970 | 109.3 | 298.38 | 2.73 |
| 2012.06 | 166 | 18,280 | 110 | 289.30 | 2.63 |
| 2012.07 | 128 | 14,120 | 110.3 | 284.57 | 2.58 |
| 2012.08 | 211 | 22,920 | 108.6 | 276.93 | 2.55 |
| 2012.09 | 251 | 27,600 | 110 | 277.20 | 2.52 |